
CAL*Explorer is an interactive tool for quick access to a wide range of California Cancer Registry (CCR) statistics organized by cancer site and by demographic characteristics such as sex, race/ethnicity, age, and region. A select number of cancer sites may also be viewed by stage at diagnosis. Statistics may be viewed as graphs or tables and downloaded for use in other programs.
The CAL*Explorer allows for direct comparison of one characteristic at a time (such as Race/Ethnicity or Sex) for selected groups. For example, you can compare Recent Trends of Lung Cancer Incidence by Race/Ethnicity for Women.
Visit the following sections to learn more:
Quick-Start Guide
The following steps provide an overview on how to use the CAL*Explorer Application.
- Select a cancer site using the Get Started with a Cancer Site dropdown list.
- Select from the list or in the first field of the list begin typing a cancer site name to see the available sites that match your term.
- The selection of cancer sites determines the data available. For example, Thyroid: Papillary subtype only has three types of data available; Incidence, Survival and Incidence for Asian Ethnicities. Other cancer sites have up to five data types available.
- Select a data type using the Choose a Statistic to Explore dropdown list.
- The data types in the dropdown list depend on the availability of the data for the cancer site selected.
- The data type you select also determines the type of graphs available. For example Incidence allows you to select Recent Trends, Recent Rates, Long-Term Trends, and Rates by Age; while Survival allows you to select 5-Year Survival and By Time Since Diagnosis.
- Select a graph type from those available by clicking on the tab.
- Some graphs are line graphs while others are bar graphs depending on which is more appropriate to your selection.
- You can move from the Graph tab to the Data Table tab to see specific numbers.
- The graph and data table will automatically update as you make selections.
- Select a Compare By variable tab.
- The variable tab opens with the primary variable (the Compare By variable) at the top.
- You can select Sex, Race/Ethnicity, Age, or California Region to compare by.
- Multiple variable values can be selected for the primary variable. For example, when comparing by gender you can select one or more of the choices which are Both Sexes (combined), Female, and Male.
- Sex, Race/Ethnicity, Age, California Region
- The variables not selected as the variable to Compare By are secondary variables.
- Select values for the secondary variables by clicking on the plus sign to open the dropdown lists and selecting a radio button next to value you want to use.
- The secondary variables can only have one value at a time.
Interface Details
When you first open CAL*Explorer, statistics for Recent Trends in CCR Incidence for All Cancer Sites Combined are displayed by default.
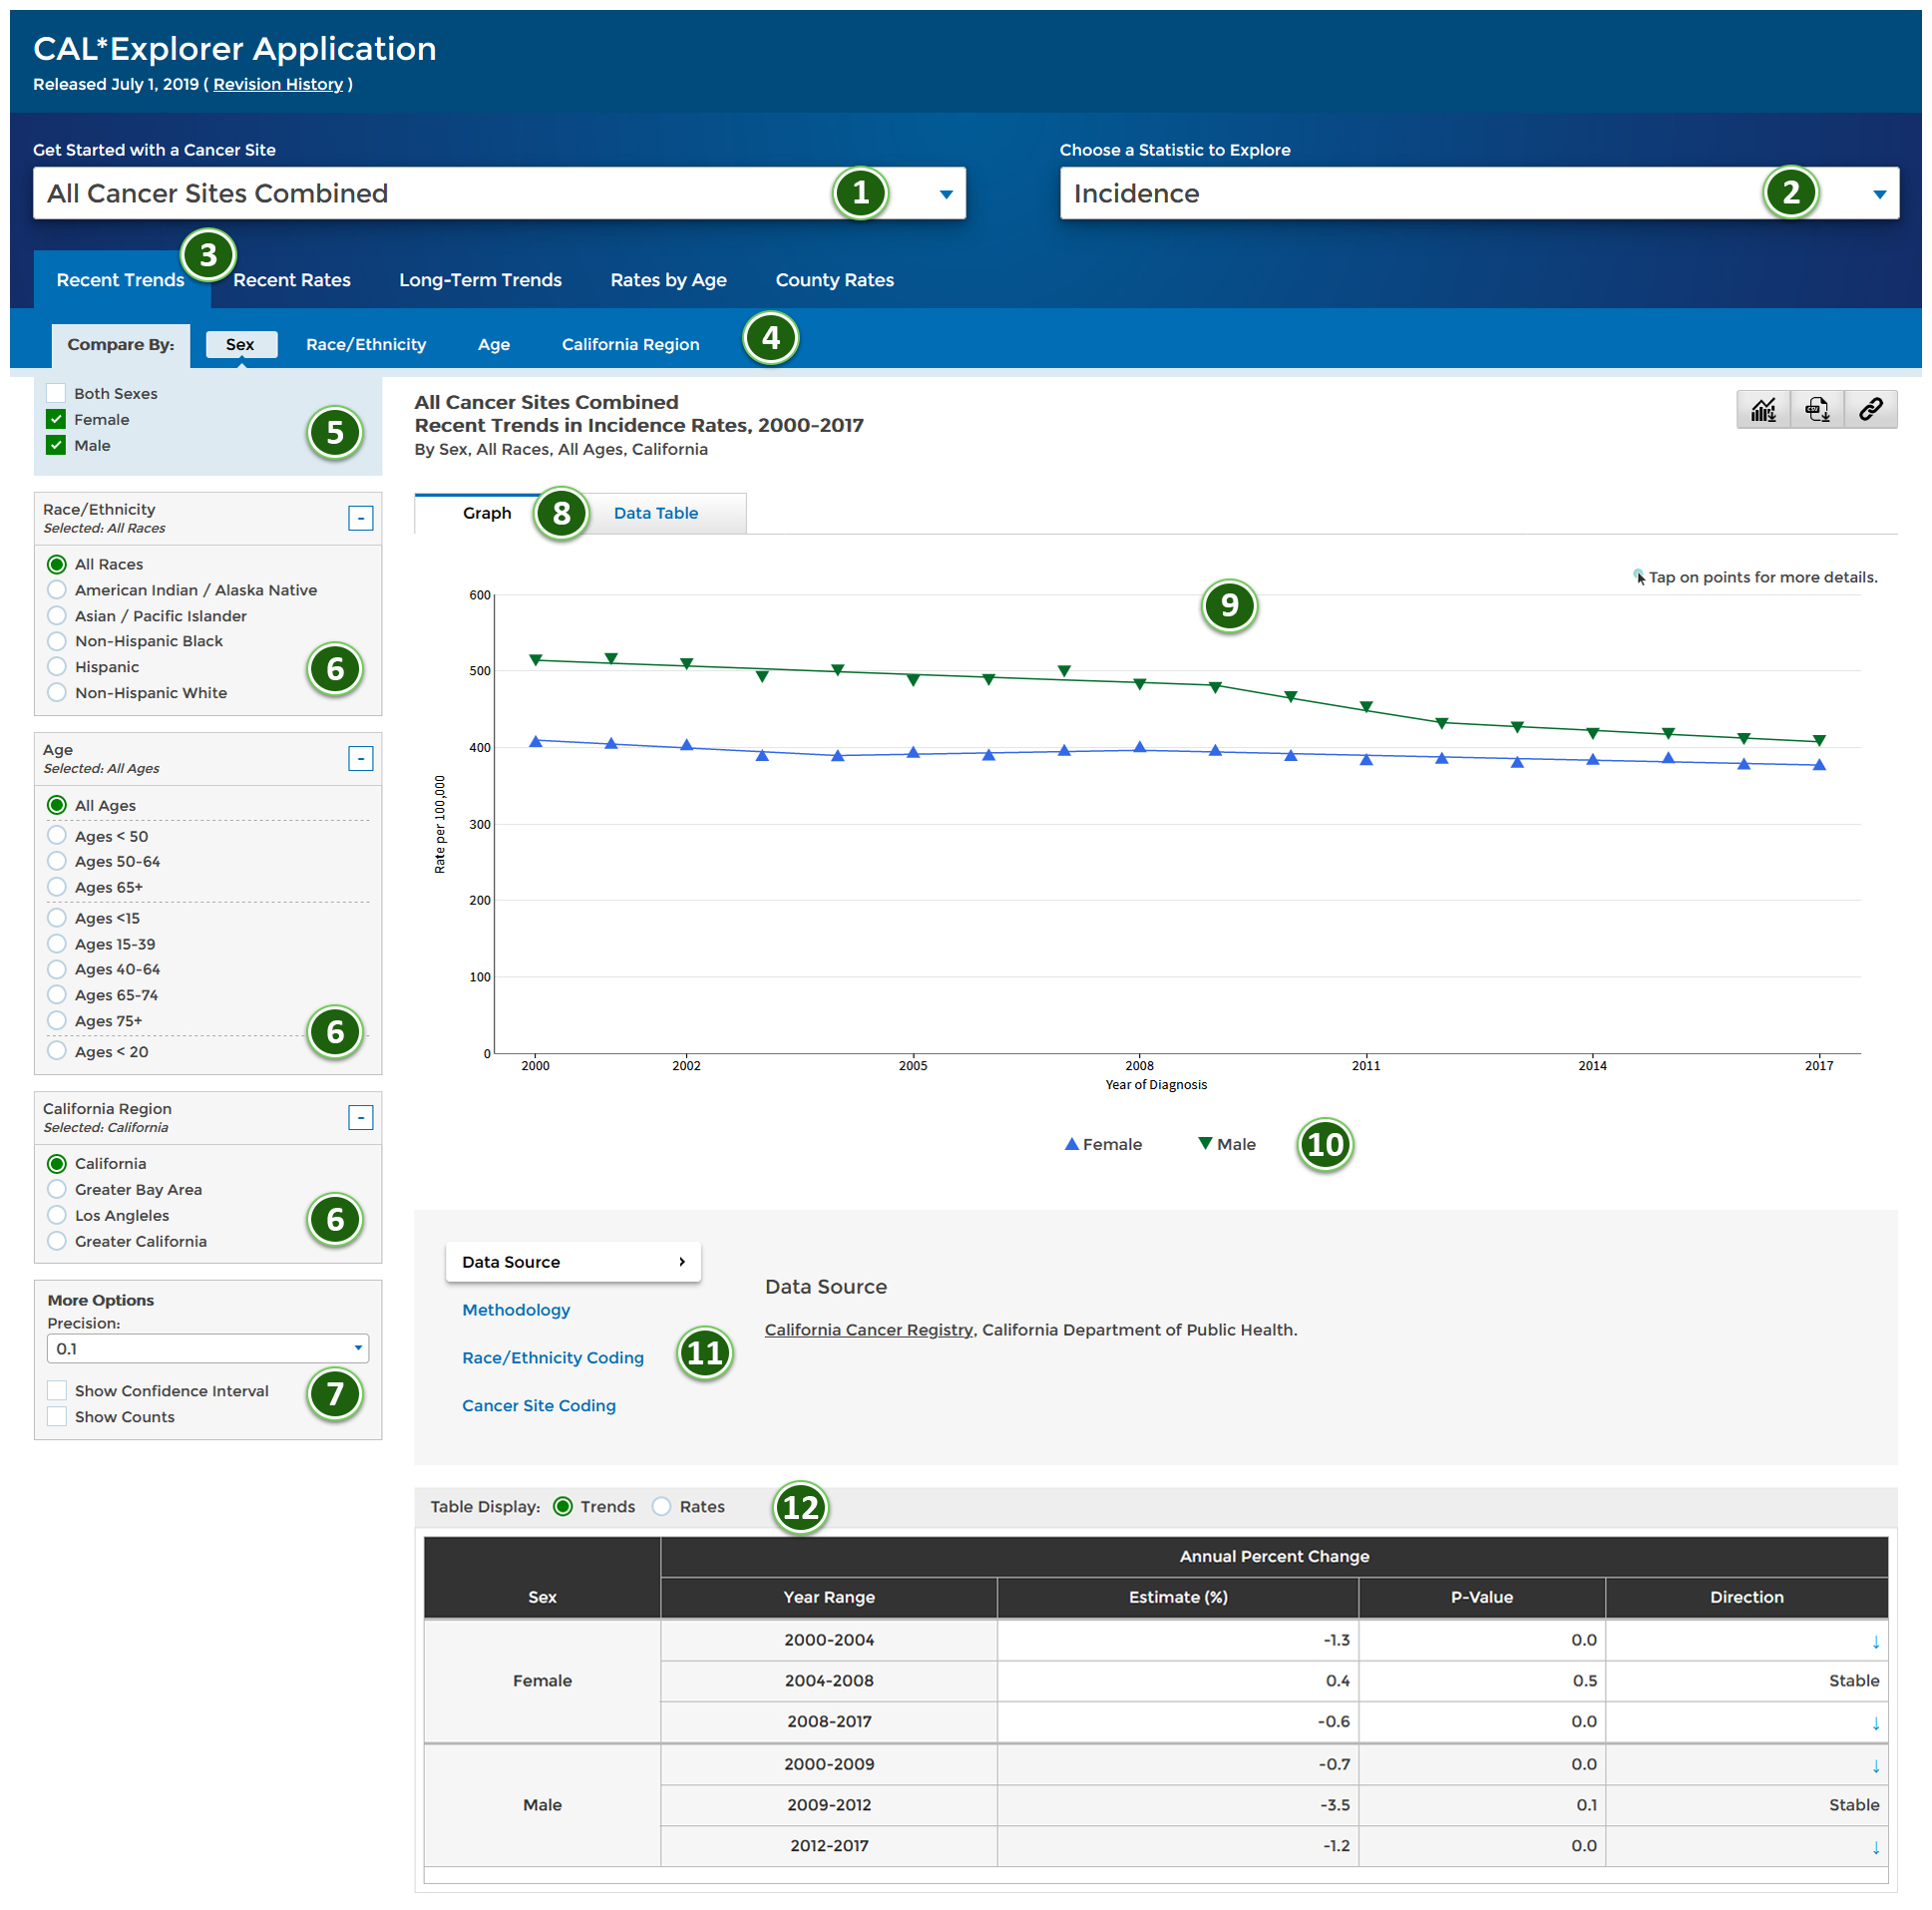
An overview of the CAL*Explorer interface. Descriptions of each numbered area are described below.
User Controls
- Choose Cancer Site
- Choose a Statistic to Explore
Includes Incidence, Mortality, Survival, Incidence for Asian Ethnicities and Mortality for Asian Ethnicities. - Graph Type
Differs based on Statistic Type selection, see the Definitions page for a list of each available graph type. - Compare By tabs
- Compare By variable values
Select more than one value to have a comparison. - Secondary variables
Select only one value from each variable. - More Options — See More Options section for details.
Results
- Selection Tabs
- Graph
- Legend
- Foot Notes
- Data Table
The data table may have choices. If so you can change your selection using the radio buttons.
More Options
The controls available under More Options are dependent on the statistic.

All of the possible controls that can appear in the More Options area.
- Precision – The number of decimal places shown in the table for Annual Percent Change (APC) or Rates may be specified here. You can set the value to 0.1, 0.01, 0.001, or 0.0001.
- Show Standard Errors – When this option is checked, Standard Errors will be displayed in the data table and will also be displayed if you hover over a data point on the graph.
- Show Confidence Interval – When this option is checked, the confidence intervals (CI) will be displayed in the data tables as columns for C.I. Low and C.I. High. The values will also be displayed if you hover over a data point on the graph.
- Show Counts – When this option is checked, the case/death count for the statistic will be displayed in the data table and will also be displayed if you hover over a data point on the graph.